

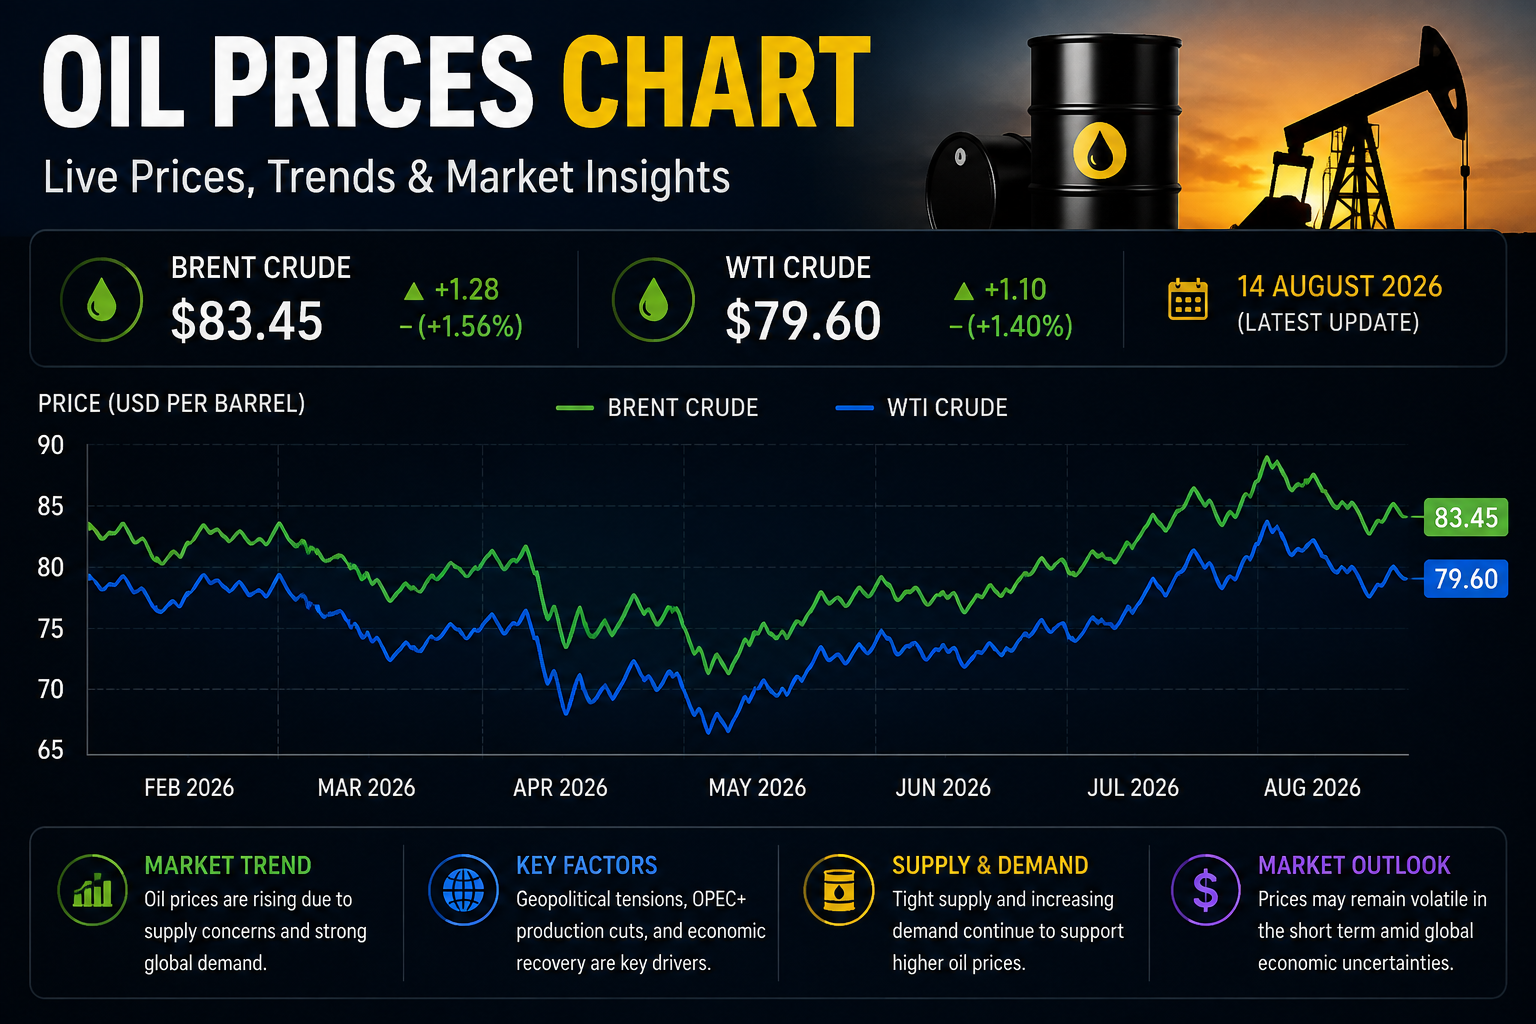
The numbers on the oil prices chart tell a story that no single headline can capture. In early August 2026, Brent crude futures traded around $89.66 per barrel, while West Texas Intermediate hovered near $83.92 . At first glance, these figures suggest a market under pressure but not in crisis. But look closer at the weekly data, and a far more alarming picture emerges—one of a global energy system pushed to its breaking point.
Just weeks earlier, on July 23, Brent had spiked to $105 per barrel . In March, it had surged past $118 . Then came a dizzying plunge to $69 in early July, followed by another sharp rebound . This is not normal market behavior. This is the fingerprint of geopolitical chaos—specifically, the ongoing US-Iran conflict and the effective closure of the Strait of Hormuz.
For business leaders, investors, and policymakers, reading the oil prices chart today requires understanding not just supply and demand fundamentals, but the intricate web of geopolitics, refining capacity, and strategic stockpiles that determine what we pay at the pump. This is the story of a market that has fundamentally broken from its historical patterns—and what comes next.
The Anatomy of a Price Spike: War, Chokepoints, and Panic
The current oil crisis traces its origins to a single strategic bottleneck: the Strait of Hormuz. Before the conflict, approximately 21.6 million barrels per day of crude oil and petroleum liquids passed through this narrow waterway between the Persian Gulf and the Gulf of Oman . Today, that flow has been slashed to a fraction of its former volume. In the second quarter of 2026, shipments through Hormuz averaged just 4.9 million barrels per day .
The numbers are staggering. The EIA estimates that Middle East crude oil production shut-ins averaged 5.5 million barrels per day in July 2026 alone . Iraq alone lost an estimated 2.5 million barrels per day of production capacity, while Saudi Arabia’s output fell by 2.5 million barrels per day from pre-war levels . This is not a temporary disruption. The EIA now projects that production and trade patterns will not return to pre-conflict conditions until early 2027, with approximately 600,000 barrels per day of capacity remaining offline through the end of that year .
What makes this crisis uniquely dangerous is the erosion of buffer stocks. Global oil inventories fell by 69 million barrels in July alone . US strategic petroleum reserves have dropped to 2.987 billion barrels—their lowest level since January 1983 . As the International Energy Agency recently warned, “the urgency of reopening the Strait has increased, as previously available inventory buffers are rapidly depleting” . The oil prices chart reflects this reality: when the safety net disappears, every geopolitical tremor translates into a price earthquake.
The Refinery Bottleneck: Why Crude Prices Tell Only Half the Story
A closer examination of the oil prices chart reveals a crucial distinction that many observers miss. While Brent crude futures have risen approximately 26 percent since February, US diesel prices have surged almost 50 percent in the same period . This divergence—between crude oil and refined products—is a function of capacity destruction that goes far beyond the upstream disruption.
The refining system is under siege on multiple fronts. The Strait of Hormuz closure has not only choked crude supply but also halted the flow of refined products that typically transit the waterway . Middle Eastern refineries themselves have been damaged or forced to shut down. And in Ukraine, a sustained campaign of long-range drone strikes has taken out significant portions of Russia’s refining capacity—as much as 43 percent by some reports . Russia has banned diesel exports entirely, and restrictions on gasoline and jet fuel shipments have further tightened global markets .
The result is a two-tiered crisis. Crude prices capture the geopolitical risk premium; refined product prices capture the real-world economic impact. As UBS analysts recently noted, energy accounts for just over 7 percent of the US consumer price basket and nearly 11 percent in the EU. But these figures understate the true inflationary effect because energy costs are embedded in everything from airfares to delivery costs . When diesel refining margins hit record highs, as they did in July 2026, the cost feeds through the entire economy . The oil prices chart at the crude level masks this downstream pressure, but the economic pain is no less real.
Reading the Signals: What the EIA and IEA Are Telling Us
The major energy agencies are projecting different paths, but the underlying message is consistent: supply constraints are here to stay. The EIA’s August 2026 Short-Term Energy Outlook raised the forecast for Brent crude’s average price in the third quarter to $85 per barrel—$11 higher than the July projection . The agency now expects Brent to average $87 per barrel for 2026, up from a previous estimate of $82 .
Longer-term, the outlook is more nuanced. The EIA projects that Brent will average approximately $69 per barrel in 2027 as production recovers and inventories rebuild . But this forecast comes with significant caveats. The assumptions underlying it include a return to normal shipping through the Strait of Hormuz by September 2026 and the restoration of Middle East output to near pre-conflict levels by early 2027 . Given the intransigence of both sides in the Iran conflict and the ongoing attacks on shipping in both the Strait of Hormuz and the Bab el-Mandeb Strait, these assumptions appear increasingly optimistic .
The IEA paints an even more concerning picture. The agency now forecasts that global oil supply will contract by 4.3 million barrels per day in 2026, even as demand declines by 1.6 million barrels per day due to high prices . The global oil balance is projected to show a deficit of 1.8 million barrels per day in the third quarter—more than double the estimate in the previous month’s report . In plain language, the supply-demand gap is widening, not narrowing.
The Geopolitical Chessboard: Iran, Saudi Arabia, and the New Risk Premium
At the heart of the oil prices chart’s volatility lies a geopolitical standoff that shows no signs of resolution. The US and Iran remain locked in a diplomatic stalemate, with Iran insisting the Strait of Hormuz will remain closed until its conditions for negotiations are met . Vessel traffic through the strait fell to just eight ships on August 11, compared to the 125 to 140 vessels that typically transited the waterway before the conflict . Commodity analytics firm Kpler reports that the volume of crude oil and condensate on tankers worldwide has reached a record 1.35 billion barrels—a sign that supply is being forced into floating storage rather than reaching consumers .
The situation is further complicated by the Bab el-Mandeb Strait, another critical chokepoint at the southern entrance to the Red Sea. Houthi attacks on Saudi-linked tankers have raised fresh concerns about traffic through this waterway, which serves as an alternative export route for Saudi crude now that Hormuz has become unreliable . Even if one chokepoint reopens, the other remains vulnerable.
The oil prices chart is effectively pricing in a permanent risk premium. Market analysts at Phillip Nova note that “the Middle East is in a tension zone between an agreement and a conflict, leading to constant fluctuations in crude oil prices between $70 and $90 per barrel” . Goldman Sachs has outlined a more dramatic scenario: in the event of a severe supply disruption, fourth-quarter Brent prices could exceed $120 per barrel . The market is not pricing for normalcy; it is pricing for uncertainty.
Implications for Business, Policy, and the Consumer
For businesses that rely on energy-intensive inputs, the oil prices chart represents a strategic challenge that can no longer be managed through short-term hedging alone. The sustained elevation of diesel and jet fuel prices—which remain significantly above pre-conflict levels—has fundamentally altered cost structures across industries from logistics to manufacturing to agriculture . The gap between crude oil prices and refined product margins suggests that this downstream pressure will persist even if crude prices moderate.
For policymakers, the crisis raises uncomfortable questions about energy security. The depletion of strategic petroleum reserves has left the United States and other OECD countries with limited ability to respond to further disruptions . The EIA’s projection that US commercial crude inventories will remain below the five-year average through the end of 2026 suggests that domestic production is unlikely to provide a quick fix .
For consumers, the outlook is mixed. EIA forecasts for retail gasoline and diesel prices have been revised upward, with the agency now expecting 2026 wholesale diesel prices to average $3.37 per gallon and wholesale gasoline $2.91 per gallon . While these figures are lower than the spikes seen in April and May, they remain substantially above the levels of early 2026 . The oil prices chart may show some relief, but the pump reflects a different reality.
Key Takeaways
- The current oil price volatility is driven primarily by the closure of the Strait of Hormuz, which has removed approximately 16 million barrels per day from global shipping routes.
- Production shut-ins in the Middle East are estimated at 5.5 million barrels per day, with recovery not expected until early 2027 at the earliest.
- Refined product prices have risen more sharply than crude prices due to downstream capacity destruction from the Middle East conflict and Ukrainian strikes on Russian refineries.
- Global oil inventories are at critical lows, with strategic reserves depleted and commercial stocks shrinking rapidly.
- The EIA projects Brent crude to average $87 per barrel in 2026, while the IEA forecasts a supply deficit of 1.8 million barrels per day in the third quarter.
- Multiple risk factors—including the Bab el-Mandeb Strait attacks, Russian refinery outages, and stalled diplomatic efforts—suggest continued volatility through 2027.
Frequently Asked Questions
What is the current price of crude oil compared to earlier in 2026?
Brent crude traded around $89.66 per barrel in mid-August 2026, down from a peak of $118 in March and $105 in late July, but still significantly above the $66 level seen in February before the conflict escalated .
How long are the Middle East disruptions expected to last?
The EIA projects that Middle East production and trade patterns will require until early 2027 to return to pre-conflict conditions, with approximately 600,000 barrels per day of production remaining offline through the end of 2027 .
Why are diesel and gasoline prices rising faster than crude oil prices?
Refining capacity has been damaged by the Middle East conflict and Ukrainian strikes on Russian refineries, creating a bottleneck that has driven record refining margins. Diesel prices have risen nearly 50 percent since February, compared to 26 percent for crude futures .
Could the US release more strategic petroleum reserves to stabilize prices?
The US strategic petroleum reserve has already been drawn down to 2.987 billion barrels, its lowest level since 1983, significantly limiting the capacity for further releases .
What is the most significant risk to oil prices in the coming months?
The primary risk is the failure of diplomatic efforts to reopen the Strait of Hormuz, combined with continued attacks on shipping through the Bab el-Mandeb Strait. Analysts warn that severe disruption could push Brent above $120 per barrel .
How are oil prices affecting global inflation?
Energy costs account for approximately 7 percent of the US consumer price basket and 11 percent in the EU. But because energy is embedded in the cost of goods and services throughout the supply chain, the total inflationary impact is significantly larger .
Conclusion: Living with Volatility
The oil prices chart of 2026 will be remembered as a watershed moment in energy markets. The comfortable assumptions of a previous era—that supply would always find demand, that chokepoints would remain open, that strategic reserves would provide a safety net—have been shattered. What remains is a market that is more volatile, more politically driven, and more precarious than at any time since the 1970s.
For those who must navigate this environment, the message is clear: the tools of the past will not suffice. Simple hedging strategies that worked in a stable market are inadequate for a world where prices can swing by 40 percent within a month . The challenge now is to build resilience—through diversified supply chains, inventory management, and strategic partnerships—that can withstand not just today’s crisis but the ones that will inevitably follow.
The oil prices chart is not just a set of numbers; it is a signal of deeper structural changes in the global economy. Understanding these shifts is not merely informative—it is essential for survival in a world of permanent volatility. Continue tracking the data, scrutinize the geopolitical signals, and prepare for a future where the only certainty is uncertainty itself.
You Mey Olso Read
Gold Price Today: Record-Breaking Rally Reshapes Global Markets
